Instagram
Engagement Rate Calculator
Free Instagram engagement rate calculator. Check any public profile in seconds, see likes, comments, ER% and tier benchmarks. No login required.
Instagram Username
- Free Forever
- No Login Required
- Works on Public Profiles
- Results in Seconds
- Free Forever
- No Login Required
- Works on Public Profiles
- Results in Seconds
Three Steps to Any
Instagram Engagement Rate
Free, instant, no signup. Get the engagement rate, average likes, comments and tier benchmark for any public Instagram profile.
Enter the username
Type any public Instagram username into the calculator. No @ symbol needed. Works with personal, brand and creator profiles.
Click calculate
Flinque pulls live public engagement data and runs the standard formula: (Likes + Comments) divided by Followers, multiplied by 100.
Read the results
See engagement rate %, average likes, average comments and tier benchmark. Compare against follower-tier averages in seconds.
What the Instagram
Engagement Rate Calculator Analyzes
Enter any public Instagram username and the tool instantly evaluates audience interaction. Here’s exactly what your engagement report reveals:
What Is Engagement Rate?
Types of Audience Engagement Signals
Instagram engagement rate is more than a number. It is a signal of attention. It shows how actively an audience interacts with content relative to its size. High engagement means real interest. Low engagement often reveals passive or disconnected followers.
- ✔ Likes: quick signals of content appreciation and visibility
- ✔ Comments: deeper interaction showing real audience interest
- ✔ Follower base: the scale against which engagement is measured
Note: A large follower count with low engagement often indicates inactive or low-quality audience segments.
Quick benchmark scale
Often signals fake or inactive followers
Typical for most Instagram accounts
High performing audience and content fit
What the calculator actually measures
- Total likes and comments across recent posts
- Engagement rate relative to follower count
- Consistency of audience interaction
- Average engagement per post
- Overall performance snapshot of the profile
The analysis uses publicly available Instagram data. No logins, no permissions, no access to your account.
Why engagement rate actually matters
- Reveals real audience interest beyond follower count
- Helps brands identify authentic influencers
- Improves campaign decision making
- Signals content performance to platform algorithms
- Prevents overpaying for low impact accounts
Quick benchmark: accounts above 6% engagement are typically considered strong performers.
How Flinque Analyzes
Instagram Engagement
Entering a username is the easy part. Here is how Flinque breaks down real engagement and performance behind the scenes.
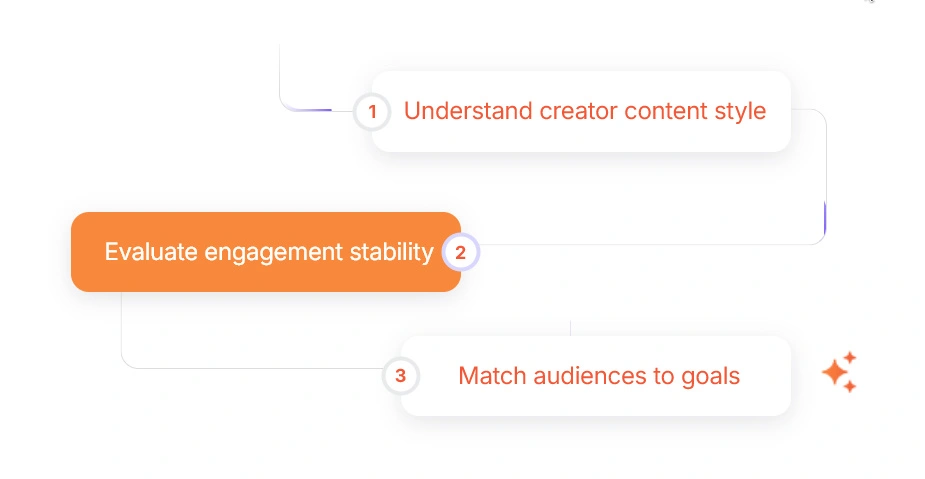
Behind the scenes
What happens after you enter a username?
Every account is analyzed across multiple engagement signals including interaction quality, audience activity, and content performance patterns.
- ✔ Multi-point engagement scoring system
- ✔ Interaction consistency and quality checks
- ✔ Content performance and growth analysis
Engagement Rate Calculation
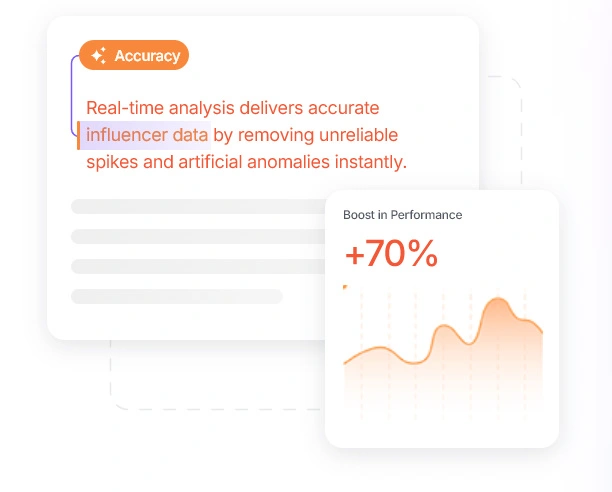
Measures likes, comments, and interactions relative to follower count to determine true engagement performance.
Interaction Quality Analysis
Evaluates the depth of engagement including meaningful comments, shares, and audience behavior patterns.
Content Performance Tracking
Analyzes post-level performance trends to identify consistency, spikes, and drops in engagement.
Audience Activity Evaluation
Identifies how active and responsive the audience is across posts over time.
Consistency & Growth Analysis
Tracks how engagement evolves with audience growth to detect performance stability or decline.
Composite Engagement Score
All signals combine into a 0–100 score. Higher scores indicate strong engagement and audience quality.
Data Privacy
The tool works entirely on publicly available Instagram data. No account login, credentials, or API access is required.
The Reality of Instagram Engagement:
Performance, Reach Quality and What Drives Real Results
Most brands track engagement. Few understand what healthy engagement actually looks like. Here is what the data reveals.
3.86%
average engagement rate for micro-influencers on Instagram
1.21%
average engagement rate for large influencer accounts
68%
of campaign performance depends on engagement quality, not follower count
2.5x
higher ROI when campaigns focus on high-engagement creators
Understanding Engagement in 2026
Engagement rate is the most reliable signal of audience quality and content performance. Across 100,000 analyzed accounts, smaller creators consistently outperform larger ones in meaningful interactions such as likes, comments, and shares.
Micro-influencers typically achieve engagement rates close to 3.86%, while larger creators often drop to around 1.21%. As audiences grow, maintaining strong interaction becomes increasingly difficult.
For brands, this translates directly into campaign performance. Higher engagement leads to better visibility, stronger trust, and significantly improved conversion rates across all stages of the funnel.
| Tier | Follower Range | Engagement Level | Average Engagement Rate |
|---|---|---|---|
| Nano | 1K – 10K | Very high | Often exceeds 5% with highly active niche audiences |
| Micro | 10K – 100K | High | Around 3%–4% engagement with strong audience interaction |
| Mid-tier | 100K – 500K | Moderate | Engagement begins to decline as audience size scales |
| Macro | 500K – 1M | Low | Lower interaction rates despite large reach |
| Mega | 1M+ | Very low | Typically around ~1% or lower engagement rate |
How Engagement Rate Impacts Campaign Performance
Engagement rate determines how effectively an audience interacts with content. A higher engagement rate signals stronger audience interest, increasing reach through platform algorithms.
Consider this: a creator with 50,000 highly engaged followers can outperform a 200,000-follower account with low interaction. The quality of engagement directly impacts cost efficiency.
Brands focusing on engagement rather than follower count consistently achieve better visibility and conversion rates.
Platform algorithms prioritize content with higher interaction, amplifying reach organically and improving campaign outcomes.
The Engagement Advantage: What You Gain
- • Higher visibility due to algorithmic amplification.
- • Lower cost per real interaction and better ROI.
- • Stronger audience trust and brand recall.
- • More reliable and predictable campaign performance.
- • Higher conversion rates from audiences that actively engage.
- • Better content insights to refine targeting and future campaigns.
Which Niches Show the Strongest Engagement
- • Education and niche communities tend to have the highest engagement rates.
- • Entertainment and meme pages generate high interaction but variable conversion.
- • Highly competitive niches often experience declining engagement as audiences scale.
- • Trust-driven niches maintain consistent and meaningful interaction over time.
Trusted by marketers who DEMAND REAL ENGAGEMENT
No vanity metrics, just real interaction, audience quality and performance clarity.
We analyze every influencer’s engagement before collaborating. It helps us spot real audience interaction, avoid low-performing creators, and make confident decisions in seconds.
Used by 400+ brands to measure real engagement, audience interaction, and campaign performance.
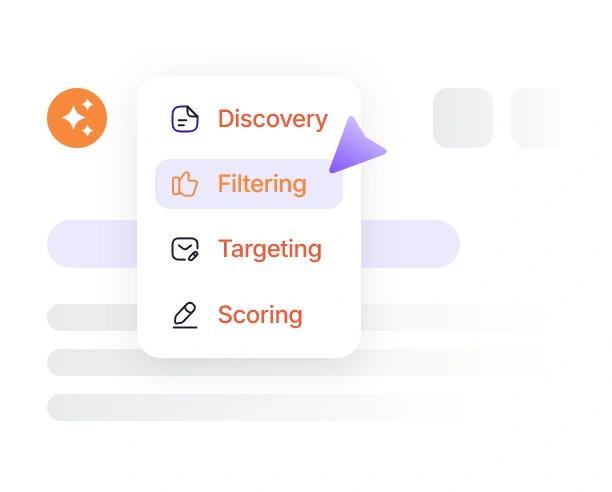
Want the Full Picture on Every Influencer You Vet?
Free tool for quick checks. Flinque gives you full influencer discovery, tracking, and analytics.
Others
$299–$600/mo
Flinque
$49/mo
Save up to $551/month compared to other platforms
Explore Flinque, $49/monthPowerful Instagram Analytics & Influencer Tools
Detect fake followers, calculate engagement, analyze profile performance, and discover influencers by location or category using our powerful Instagram analytics toolkit.
Instagram Fake Follower Checker
Detect fake, inactive, or suspicious followers on any public Instagram account and evaluate audience authenticity instantly.
Instagram Follower Following Ratio Calculator
Analyze the follower-to-following ratio of any public Instagram account to assess credibility and growth at a glance.
Instagram Compare Accounts
Compare Instagram accounts side-by-side to identify differences in engagement, follower count, and more.
Instagram Like to Follower Ratio Calculator
Analyze the relationship between likes and followers to quickly identify suspicious engagement or fake growth patterns.
Find Instagram Influencers by Location
Discover Instagram influencers from specific cities, regions or countries to run targeted marketing campaigns.
Find Instagram Influencers by Niche
Search Instagram influencers by niche, category or topic. Discover the right micro and mid tier creators for any campaign.
Instagram Lookalike Finder
Find Instagram influencers similar to any creator by audience, niche and engagement signals. Surface lookalikes for your top performers.
Instagram Engagement Rate Calculator FAQ
Common questions brands, agencies and creators ask about Instagram engagement rate, the formula and how to read the results.
An Instagram engagement rate calculator is a free tool that measures how actively a profile's audience interacts with its content. It pulls public data on likes, comments and follower count, then returns the engagement rate as a percentage so brands, agencies and creators can vet influencer performance fast.
The standard Instagram engagement rate formula is (Likes + Comments) divided by Followers, multiplied by 100. Most modern calculators use the average across the last 12 to 18 posts to filter out viral spikes and give a stable number that reflects real audience activity.
A good Instagram engagement rate depends on follower tier. Nano accounts under 10K typically see 4 to 8 percent. Micro accounts at 10K to 100K average 2 to 4 percent. Mid tier accounts at 100K to 500K hover around 1 to 2 percent. Mega accounts above 500K usually sit between 0.5 and 1.5 percent. Anything above the tier average signals a high quality audience.
Across all Instagram tiers, the average engagement rate sits between 1 and 3 percent based on industry data from major influencer platforms. Nano and micro creators typically pull the highest engagement, while mega creators trade engagement for reach.
Yes. A 5 percent Instagram engagement rate is strong for almost any follower tier. For nano and micro accounts it sits in the healthy band, and for accounts above 100K followers it is excellent and indicates an unusually active audience worth working with.
No login is required. Enter any public Instagram username and Flinque returns the engagement rate, average likes, average comments and tier benchmark instantly. The calculator only uses publicly available Instagram data and never asks for your credentials.
Yes. The Flinque Instagram engagement rate calculator works on any public Instagram profile, including competitors and influencers you have not partnered with yet. This makes it useful for benchmarking, influencer vetting and pre-campaign research.
Low engagement usually points to one of three issues: a high share of inactive or fake followers, content that does not match what the audience expects, or posting at times when the audience is offline. Run the Flinque fake follower checker alongside the engagement calculator to see if audience quality is the cause.
Flinque pulls live public data from Instagram and averages engagement across recent posts, then benchmarks against follower tier ranges. The result reflects real audience activity rather than self reported numbers, and matches the methodology used by enterprise influencer marketing platforms.
Yes. The Flinque Instagram engagement rate calculator is free forever, with no signup, no credit card and no usage caps. Brands and agencies that need bulk vetting, audience demographics and lookalike discovery can upgrade to the Flinque platform for $49 per month.