Compare Instagram Accounts
Compare up to five Instagram accounts side by side — followers, engagement, and key stats. Free, no login required.
Compare Instagram Accounts on Various Industry Benchmarks
Add up to 5 accounts and populate this table.
Three Steps to
Compare Any Two Instagram Accounts
Free, instant, no signup. Get a full side by side comparison of engagement, followers, ratios and audience quality.
Add the first account
Type any public Instagram username into the left input. No @ symbol needed. Works with personal, brand and creator profiles.
Add the second account
Type the second public Instagram username into the right input. Click Compare. Flinque pulls live public data on both profiles.
See the winner instantly
Read engagement rate, followers and ratios for both accounts side by side. Green and red arrows show which account leads on each metric.
What Flinque Compares Across
Instagram Accounts
Compare multiple Instagram accounts and instantly understand which profile performs better across engagement, audience quality, and content impact.
Comparison Signals
Key metrics used to compare accounts
Instead of analyzing a single account, Flinque compares multiple profiles side by side to reveal real differences in performance, engagement, and audience quality.
- ✔ Likes, compared across accounts to measure content appeal
- ✔ Comments, compared to identify deeper audience interaction
- ✔ Followers, used to evaluate engagement relative to audience size
Insight: Smaller accounts often outperform larger ones when compared on engagement, revealing stronger audience connection.
~1%
Lower performance in comparison
2.5–4%
Balanced performance
4%+
Strong performer in comparison
What gets compared
- • Engagement rate across accounts
- • Likes and comments comparison
- • Consistency of interaction
- • Content performance differences
- • Overall account strength
Uses only publicly available Instagram data. No login required.
Why comparison matters
- • Identify the better-performing account instantly
- • Avoid relying only on follower count
- • Select creators based on real engagement
- • Improve campaign decisions
- • Spot hidden high-performing profiles
Tip: Higher engagement usually indicates stronger audience connection.
How Flinque Compares
Instagram Accounts
Enter multiple usernames and instantly compare engagement, audience quality, and performance side by side.
Comparison Logic
What happens when accounts are compared?
Each account is evaluated across key metrics to highlight which profile performs better in real engagement, audience activity, and content consistency.
- ✔ Side-by-side engagement comparison
- ✔ Interaction quality and consistency insights
- ✔ Performance comparison across content and growth
Engagement Comparison
Compares engagement rates to identify which account drives stronger audience interaction.
Interaction Quality
Evaluates likes, comments, and behavior to highlight meaningful engagement differences.
Content Performance
Compares post performance to identify consistency and impact across accounts.
Audience Activity
Measures how active and responsive each audience is over time.
Growth vs Engagement
Highlights how follower growth impacts engagement across compared profiles.
Overall Comparison Score
Combines all metrics into a clear score to identify the better-performing account.
Data Privacy
The tool uses only publicly available Instagram data. No login, credentials, or API access required.
Compare Instagram Accounts:
Engagement, Audience Quality and Performance Side by Side
Most brands look at accounts individually. Smart teams compare multiple profiles to identify true performance and make better decisions.
2.5%–4%
typical engagement rate seen when comparing high-performing micro accounts
1%–1.5%
average engagement rate revealed when comparing larger accounts
High Impact
of performance differences become clear when comparing engagement, not followers
↑ ROI
better results when selecting creators through account comparison
Compare Accounts with Clarity
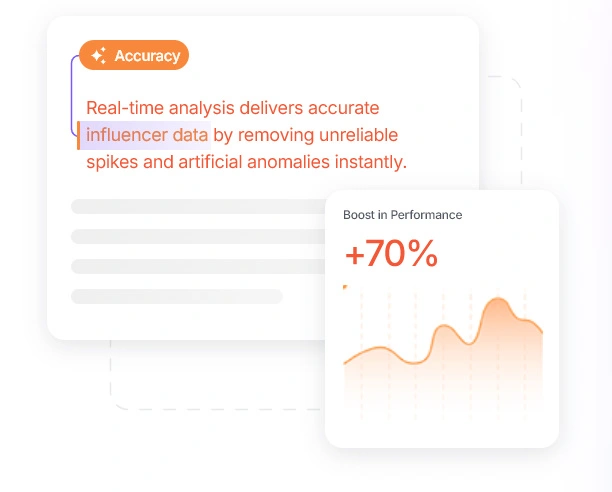
When multiple accounts are compared side by side, real performance differences become obvious. Engagement rate highlights which creators drive actual interaction and which ones only appear strong based on follower count.
Smaller accounts often show stronger engagement, typically in the 2.5%–4% range, while larger accounts tend to drop closer to 1%–1.5%. Comparing these metrics makes it easy to identify which profile delivers better audience response.
This allows brands to make faster, more confident decisions by choosing creators based on real performance, not assumptions.
| Account Type | Follower Range | Comparison Insight | Engagement Range |
|---|---|---|---|
| Nano | 1K – 10K | Strongest engagement | 4%–6%+ |
| Micro | 10K – 100K | Best balance | 2.5%–4% |
| Mid-tier | 100K – 500K | Varies | 1.5%–2.5% |
| Macro | 500K – 1M | High reach, low engagement | 1%–1.5% |
| Mega | 1M+ | Lowest engagement | <1% |
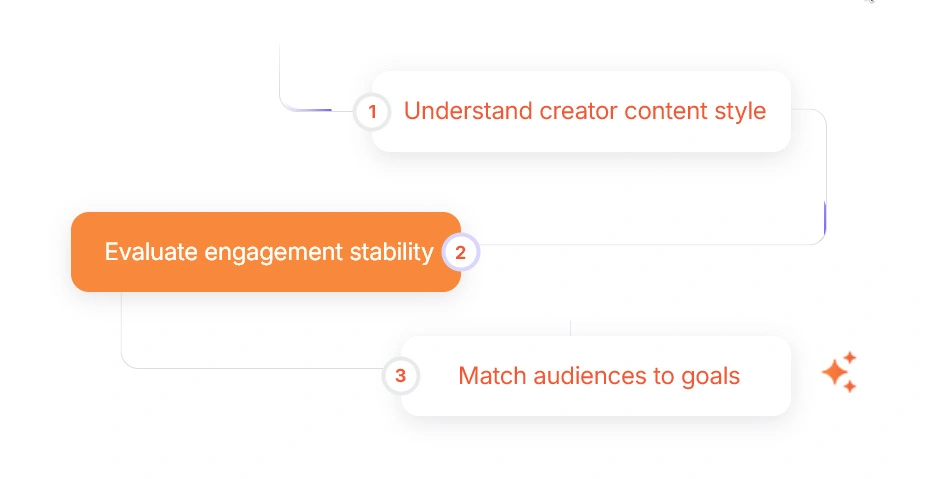
How to Read Your Comparison Results
Engagement rate shows which account drives stronger audience interaction. When comparing profiles, higher engagement usually indicates better content performance.
An account with fewer followers but higher engagement can outperform larger profiles. Comparison helps reveal real influence beyond surface-level numbers.
Focus on engagement, likes, and comments together to understand which creator delivers consistent results.
Use these insights to choose creators based on actual performance, not just follower size.
What You Gain from Comparison
- • Identify the better-performing account instantly.
- • Choose creators based on real engagement.
- • Improve ROI by avoiding low-performing profiles.
- • Make faster, data-driven decisions.
- • Spot hidden high-performing smaller accounts.
- • Compare multiple metrics in one view.
What to Look for in Comparison
- • Higher engagement rate vs follower count.
- • Consistent likes and comments across posts.
- • Balance between reach and interaction.
- • Stable performance, not spikes.
Compare accounts like pros who
TRUST DATA OVER HYPE
Side-by-side comparison of engagement, audience quality, and content performance, no guesswork, just clarity.
Comparing multiple accounts before choosing creators changed everything. We quickly spot who drives real engagement and who just looks good on the surface.
Used by 400+ brands to compare creators, evaluate performance, and choose the right influencers with confidence.
Want the Full Picture on Every Influencer You Vet?
Free tool for quick checks. Flinque gives you full influencer discovery, tracking, and analytics.
Others
$299–$600/mo
Flinque
$49/mo
Save up to $551/month compared to other platforms
Explore Flinque, $49/monthPowerful Instagram Analytics & Influencer Tools
Detect fake followers, calculate engagement, analyze profile performance, and discover influencers by location or category using our powerful Instagram analytics toolkit.
Instagram Fake Follower Checker
Detect fake, inactive or suspicious followers on any public Instagram account and evaluate audience authenticity instantly.
Instagram Follower Following Ratio Calculator
Analyze the follower to following ratio of any public Instagram account to assess credibility and growth at a glance.
Instagram Engagement Rate Calculator
Calculate real engagement rates using likes, comments and followers to understand how active an audience truly is.
Instagram Like to Follower Ratio Calculator
Analyze the relationship between likes and followers to quickly identify suspicious engagement or fake growth patterns.
Find Instagram Influencers by Location
Discover Instagram influencers from specific cities, regions or countries to run targeted marketing campaigns.
Find Instagram Influencers by Niche
Search Instagram influencers by niche, category or topic. Discover the right micro and mid tier creators for any campaign.
Instagram Lookalike Finder
Find Instagram influencers similar to any creator by audience, niche and engagement signals. Surface lookalikes for your top performers.
Compare Instagram Accounts FAQ
Common questions brands, agencies and creators ask about comparing Instagram accounts side by side and reading the metrics.
Compare Instagram Accounts is a free tool that places any two public Instagram profiles side by side and benchmarks them on engagement rate, follower count, follow ratio, audience quality and content performance. Brands and agencies use it for influencer vetting, while creators use it to track competitors.
Enter the first Instagram username, then enter the second username. Click Compare. Flinque pulls live public data on both accounts, computes the comparison metrics, and shows them in a side by side dashboard with green and red arrows indicating which account leads on each metric.
Flinque highlights the account with the higher engagement rate as the winner. While followers matter for reach, engagement rate shows how much the audience actually cares about the content, which is the better predictor of campaign performance.
The most useful metrics for comparing Instagram accounts are engagement rate, follower count, like to follower ratio, follower to following ratio, posting frequency, and audience quality score. Engagement rate is the strongest single signal of real audience trust, while follower count alone can mislead because of fake followers.
Yes. The Flinque comparison tool works on any two public Instagram accounts regardless of category. This is useful for brands wanting to see how they stack up against an influencer they are considering, or for agencies benchmarking client accounts against industry leaders.
The green up arrow indicates that a specific metric is higher on that account compared to the other. The red down arrow means that account has a lower value for that specific metric. The arrows make scanning the comparison fast without reading every number.
Yes. Every time you run a comparison, Flinque pulls the latest available public data for both accounts. This makes the comparison accurate for the present day rather than relying on cached numbers from weeks ago.
Brands typically shortlist three to five creators in a niche, run side by side comparisons to identify the strongest engagement, then check fake follower percentage and audience demographics on the top two. The Flinque comparison tool covers the first step instantly. The full Flinque platform handles the full vetting workflow at $49 per month.
No login is required. Enter any two public Instagram usernames and Flinque returns the side by side comparison instantly. The tool only uses publicly available Instagram data and never asks for your credentials.
Yes. The Flinque Compare Instagram Accounts tool is free forever, with no signup, no credit card and no usage caps. Brands and agencies that need bulk vetting, audience demographics and lookalike discovery can upgrade to the Flinque platform for $49 per month.